Results gallery
Example outputs produced by QE-to-TCAD after a full calculation.
Carbon (diamond, Fd-3m)
Extracted properties:
- ε₀ ≈ 6.74 (experimental: 6.72)
- ω_p ≈ 28.9 eV
- Isotropy: |ε_x − ε_y| < 0.01 %
- Zero-crossing (plasma frequency) at ~12.3 eV
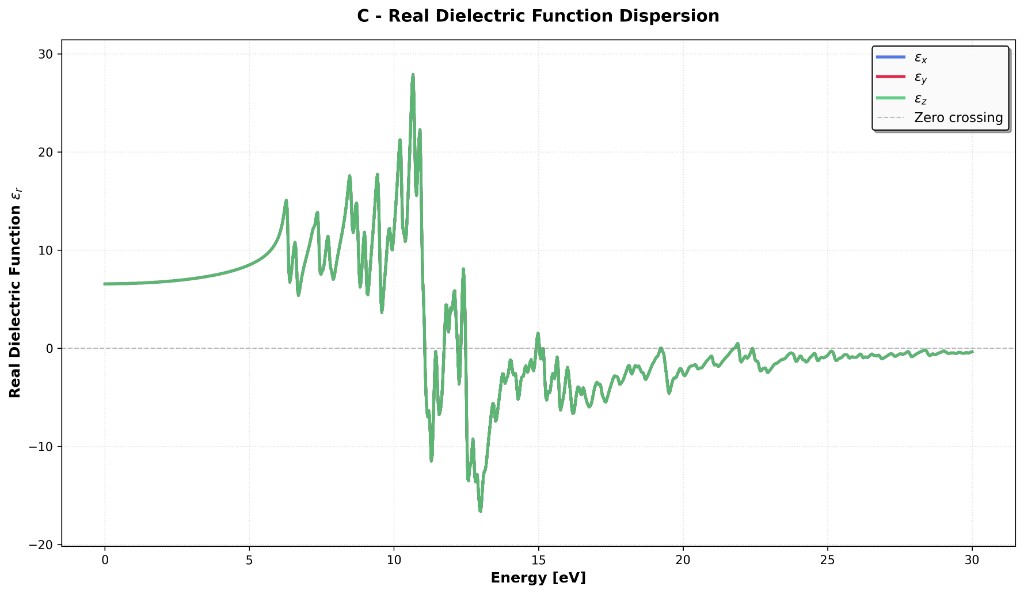
High-resolution PNG figures are generated in plots/:
qe-plot C
# → plots/C_dielectric_dispersion.png
Silicon (cubic, Fd-3m)
Example exported JSON (parsed_data/Si.json):
| Property | Computed value |
|---|---|
| Band gap | 1.68 eV (indirect) |
| ε₀ | ~15.9 |
| m*_e | 0.12 m₀ |
| m*_h | 0.85 m₀ |
Materials available / in progress
| Material | Structure | Status |
|---|---|---|
| C | Diamond (Fd-3m) | ✓ Validated |
| Si | Cubic (Fd-3m) | ✓ Available |
| Ge | Cubic (Fd-3m) | ✓ Available |
| SiGe | Alloy | ✓ Available |
| Fe | Metal | ✓ Available |
| Zn | Hexagonal (P6₃/mmc) | In progress |
| Graphene | 2D | In progress |
See the parsed_data/ folder in the repository for full JSON files.
Convergence curves
python3 plot_convergence_progressive.py convergence_data/Si_convergence.json
Produces plots showing total energy and band-gap evolution versus ecutwfc and k-points.
TCAD validation — SiGe
1D device simulation results obtained with qe-tcad from SiGe properties exported by the pipeline.
Diode
Forward-bias I–V characteristic and electrostatic potential profile at equilibrium.
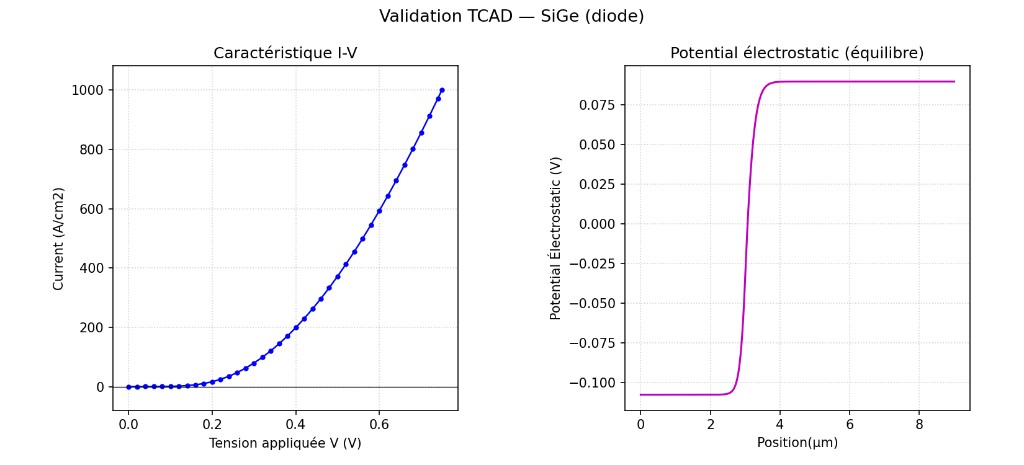
qe-tcad SiGe diode
NPN transistor
I–V characteristic and equilibrium potential profile for a SiGe NPN transistor.
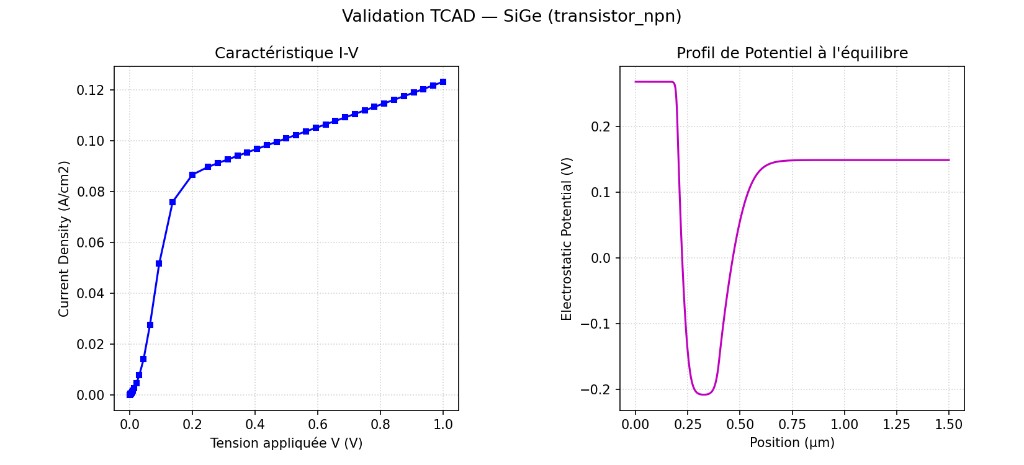
qe-tcad SiGe transistor
Reproduce these results
qe-bridge SiGe
qe-plot SiGe
qe-tcad SiGe diode
qe-tcad SiGe transistor
See Usage for the full guide.